
What you need to know to take care of your investment portfolio
Buying investments is the easy part - maintaining them is what most investors find challenging. Learn to review, rebalance, and make rational decisions without letting emotions take over.
Last updated on 28 September 2026
Key takeaways
Regularly reviewing your portfolio is essential — market conditions change, and what suited your investment goals last year may no longer do.
Market indices like the Straits Times Index (STI) help you gauge how the local market is performing, but should be assessed over a meaningful period, not just a single day.
Economic indicators — leading, lagging, and coincident — give you a picture of where the economy has been, where it is now, and where it may be heading.
How you respond to any indicator depends on your own goals, risk appetite, and investment horizon.
Why regular reviews matter
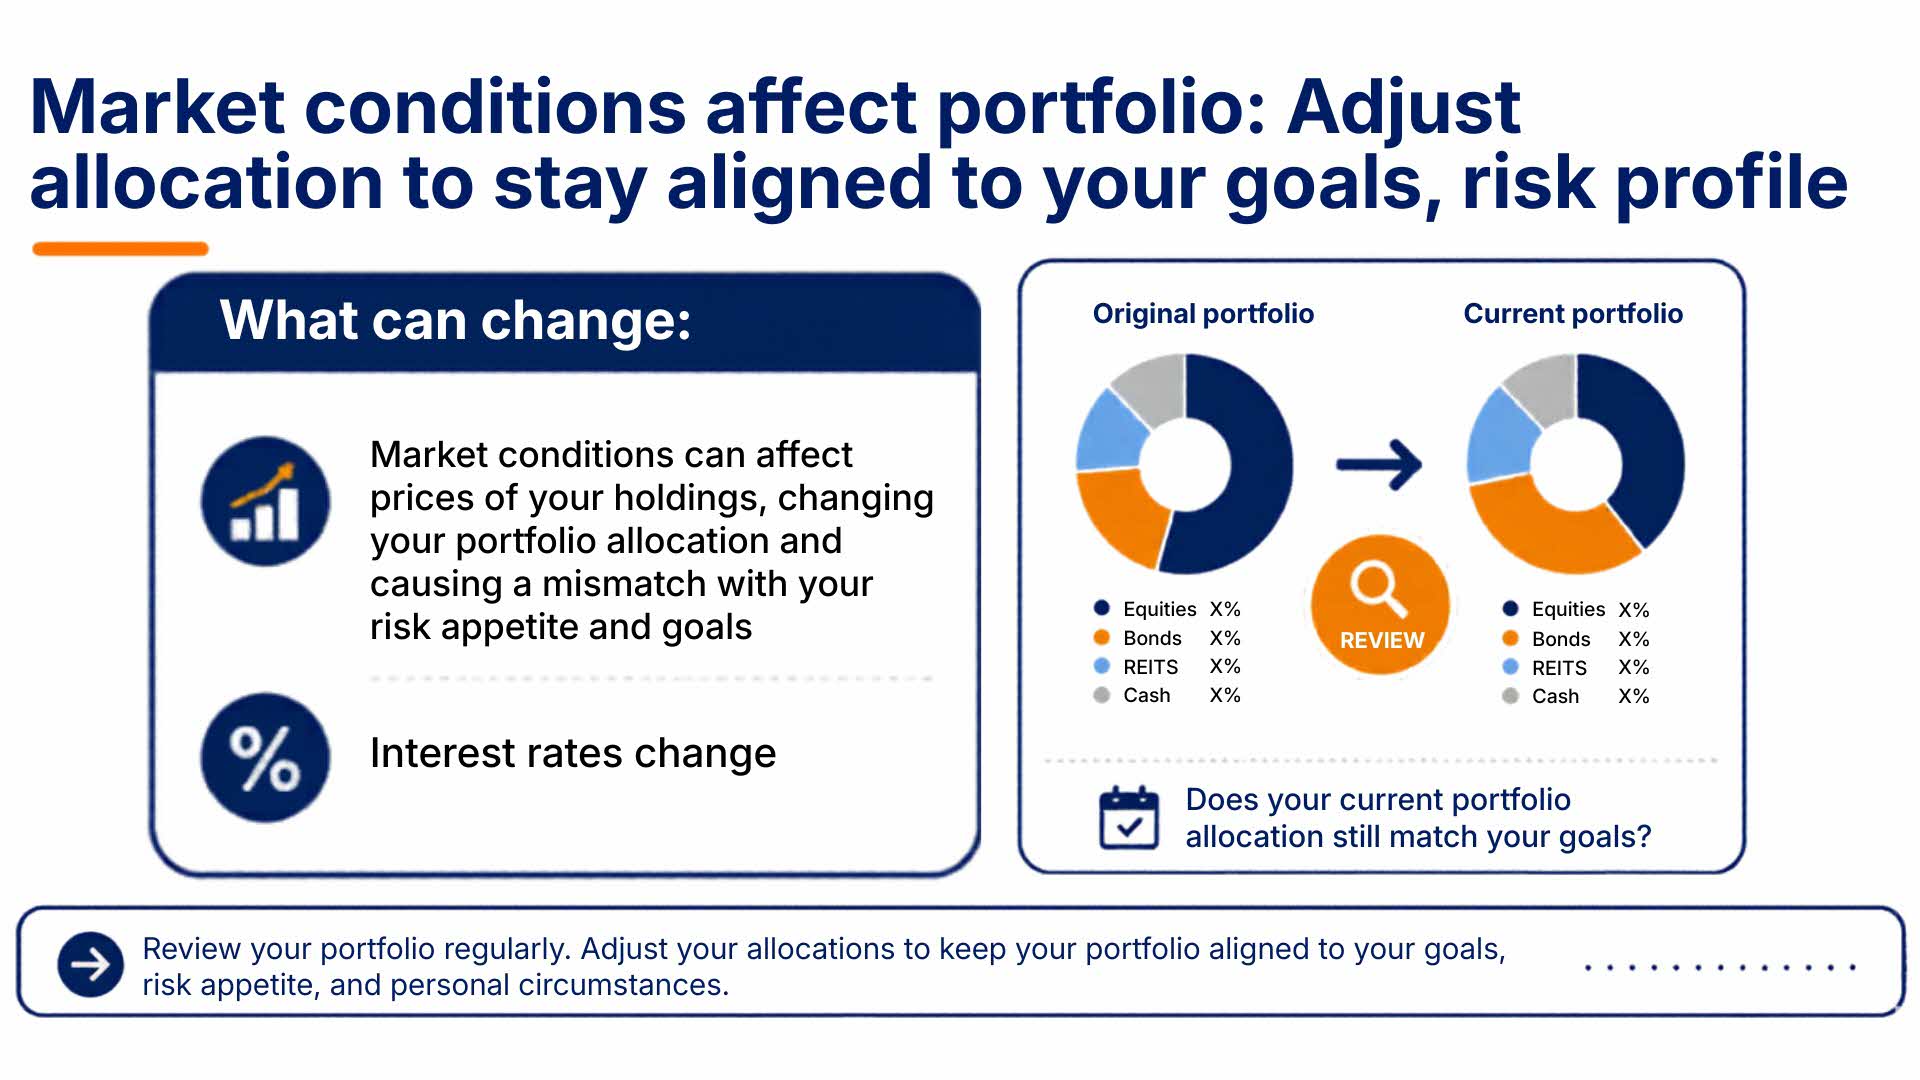
Market conditions can shift significantly over time. A portfolio that matched your goals and risk appetite when you built it may drift out of alignment as markets move, interest rates change, or your personal circumstances evolve.
For example: if the economy is expected to contract, you might want to increase your allocation to ‘defensive’ investments — those that tend to hold their value during downturns, such as bonds or essential-services stocks. If the economy is expanding, ‘cyclical’ investments that move in tandem with economic growth may offer stronger returns.
One practical way to stay informed is to track market and economic indicators. This article explains the most commonly used ones.
Market indicators
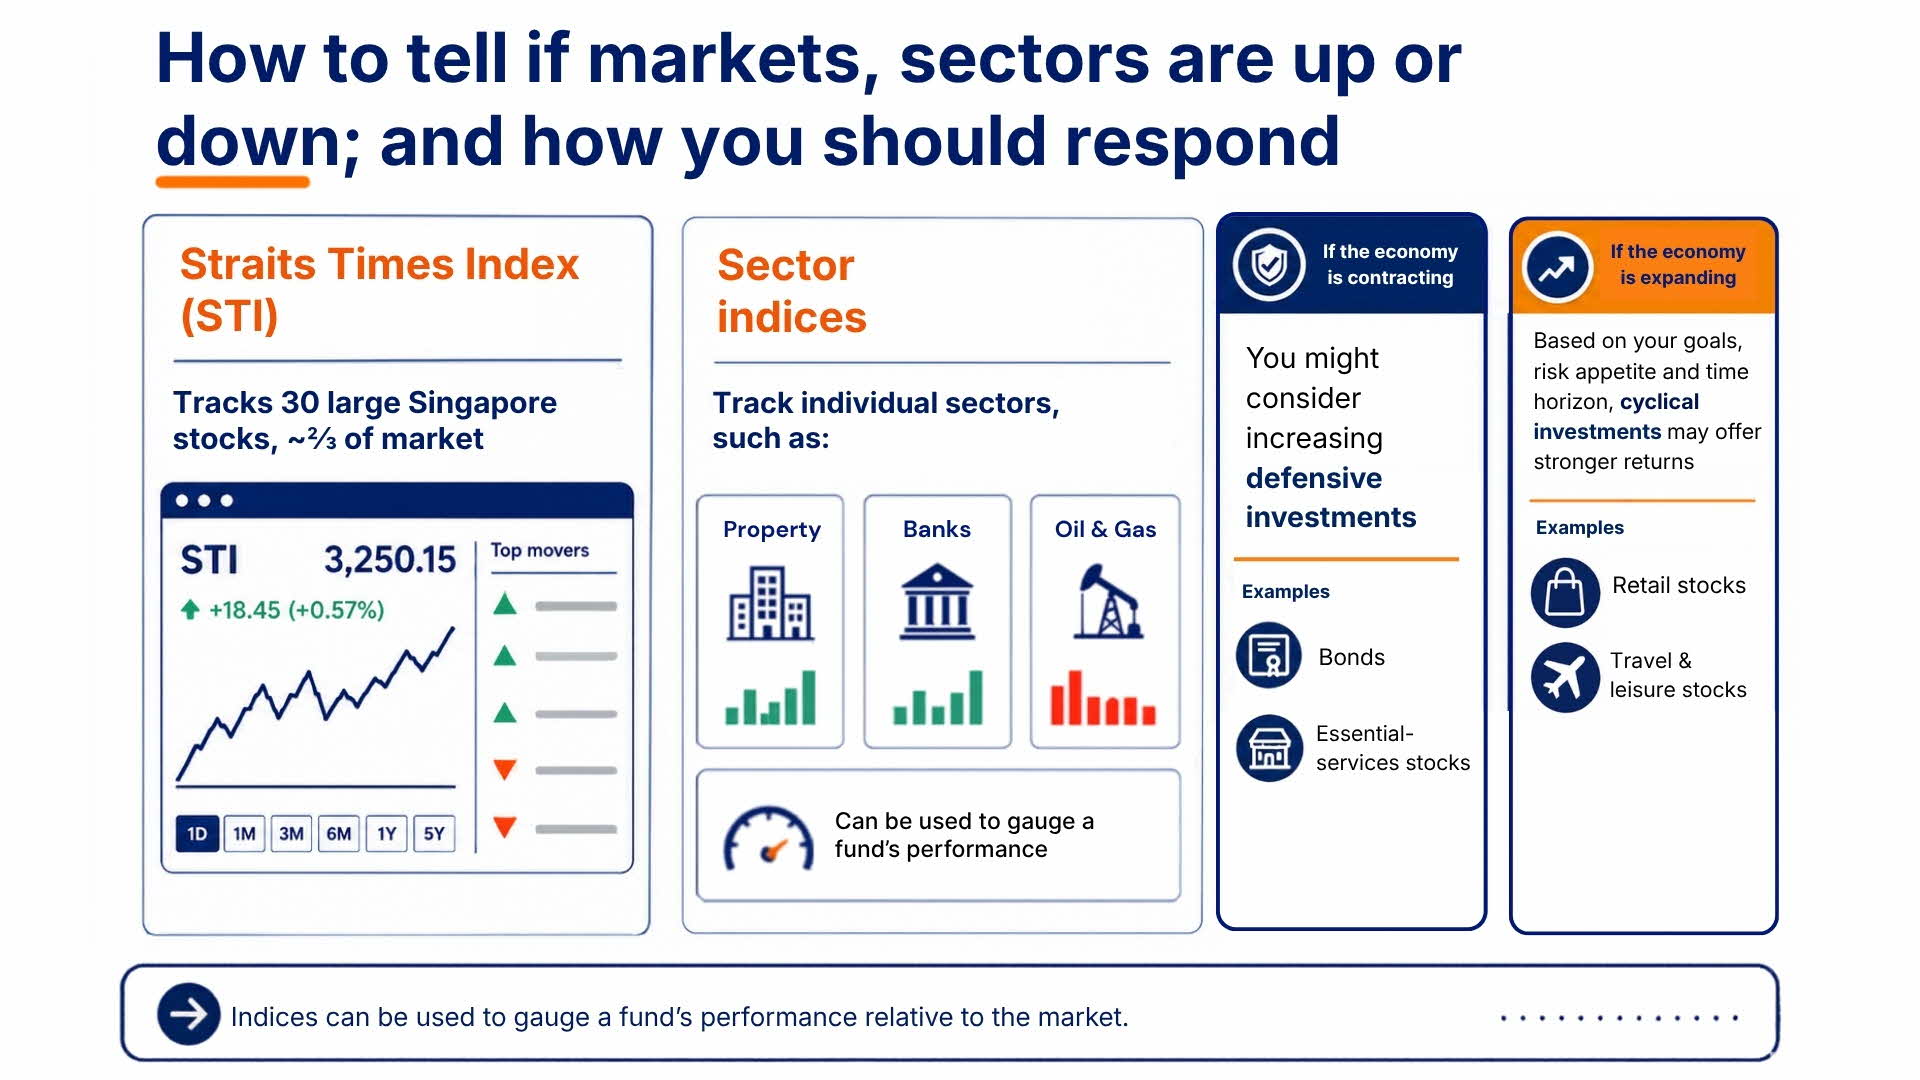
The Straits Times Index (STI) is the most widely recognised benchmark for the Singapore stock market. It tracks the 30 largest companies listed on the SGX, weighted by market capitalisation (share price multiplied by the number of shares in issue). Together, these 30 companies account for roughly two-thirds of the total Singapore market. When the STI rises or falls, we say the market has risen or fallen.
A second benchmark you may encounter is the Morgan Stanley Capital International (MSCI) Singapore Index, which is constructed slightly differently — it includes some mid-sized companies as well — but serves the same purpose of tracking overall Singapore market performance.
Sector-specific indices are also available for Singapore investors, covering areas such as property stocks, financial services, oil and gas, and small-to-mid-cap companies. Most are provided by FTSE Russell in partnership with SGX.
Market indices are also used to benchmark the performance of fund managers. If your unit trust is invested in Singapore equities, its manager’s returns may be compared to the STI or MSCI Singapore Index.
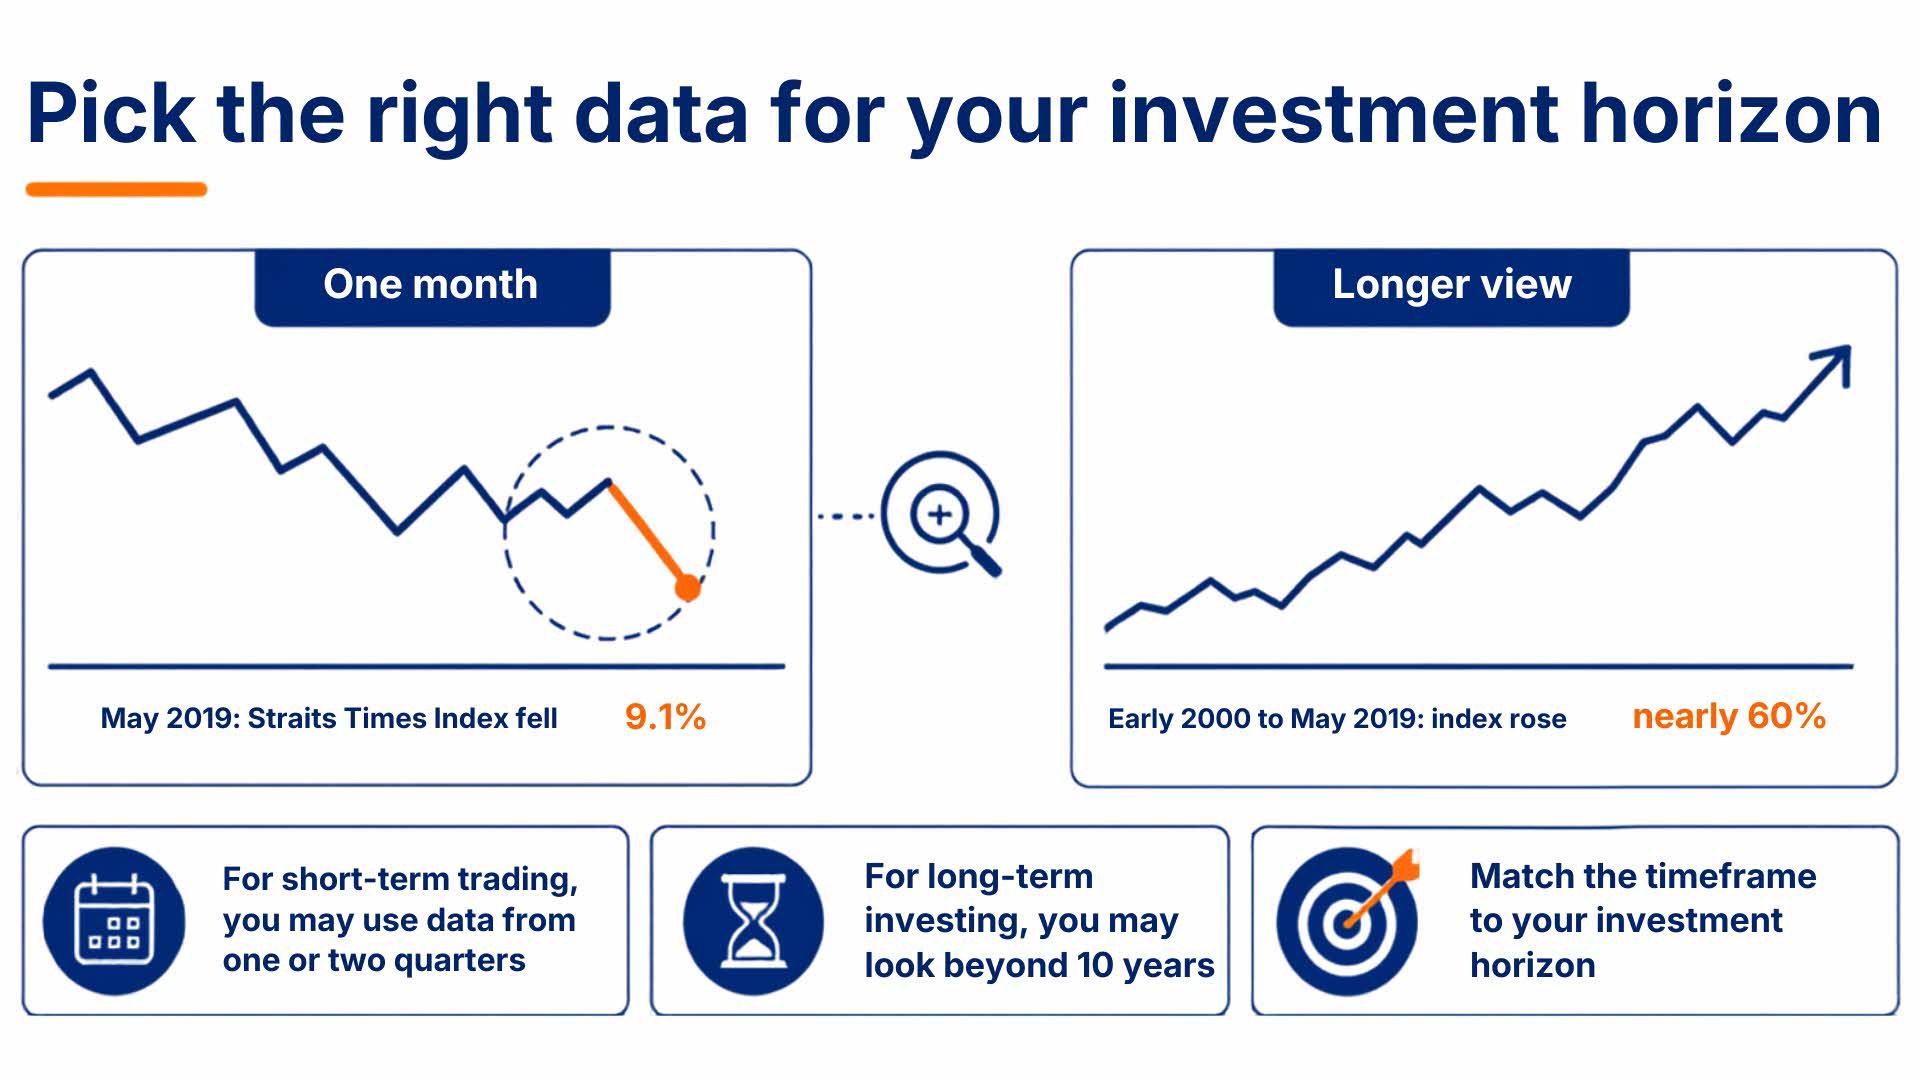
Important: Evaluate the STI over a meaningful period, not just a single day or month. Short-term volatility can be misleading. A month-long fall may look alarming, but a ten-year chart may tell a very different story. The time frame you choose should match your investment horizon.
Other headline indices to be aware of for global context:
Hang Seng Index: Hong Kong's main market benchmark
Nikkei 225: Japan's main market benchmark
Dow Jones Industrial Average and S&P 500: the two key benchmarks for the United States
Economic indicators
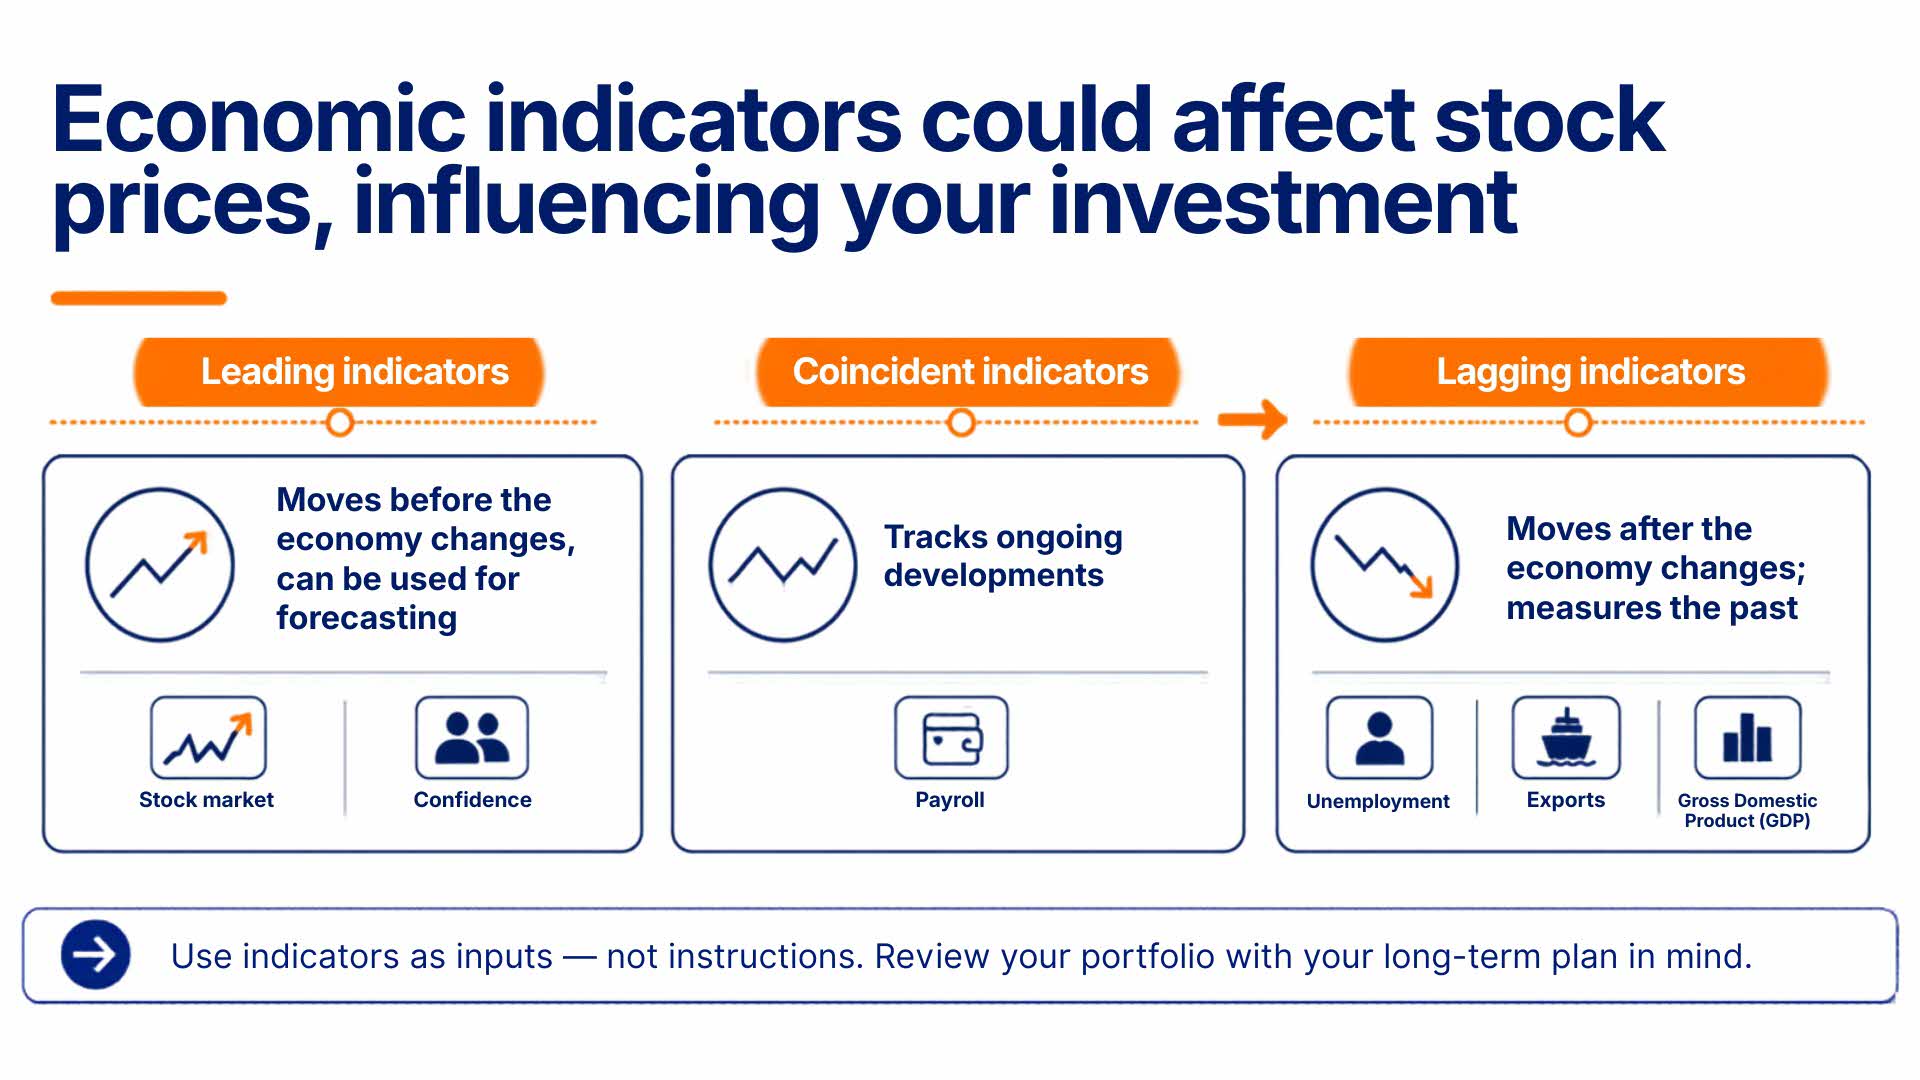
Economic indicators are statistics that help you assess the health of the broader economy. This matters because economic conditions influence corporate earnings, which in turn drive share prices.
Indicators fall into three categories:
Economic indicators
Categories | What does it indicate? | Examples |
|---|---|---|
Leading indicators | Change before the economy shifts, making them useful for forecasting. | - The stock market itself (which often anticipates expansions or contractions six to twelve months ahead) - The Consumer Confidence Index (CCI), which surveys households about their expectations for the economy. |
Lagging indicators | Change after the economy has already moved, confirming a trend. | - The unemployment rate (which tends to improve only after the economy has already expanded) - Corporate profits - Exports - Gross Domestic Product (GDP) — the total output of an economy over a given period. |
Coincident indicators | Change roughly in step with the economy, providing a picture of current conditions. | - Payroll data, which reflects current employment levels and the skills being demanded in the labour market. |
Analysts typically look at all three types together to understand where the economy has been, where it stands now, and where it is likely to go.
Other useful indicators
Two additional indicators are frequently used alongside the three categories of economic indicators named above:
Purchasing Managers’ Index (PMI): Measures activity in the manufacturing sector. A reading above 50 signals expansion; below 50 signals contraction. It is a widely-watched early indicator of economic momentum.
Consumer Price Index (CPI): Measures inflation, i.e. how quickly the general price level is rising. High inflation erodes the purchasing power of your returns, so it directly affects the real value of your investments.
At the company or industry level, analysts also compare financial ratios against industry averages to identify outliers. For example, if the average debt-to-asset ratio in an industry is 40% and a specific company you are considering has 65%, that is worth investigating.
Putting indicators in context
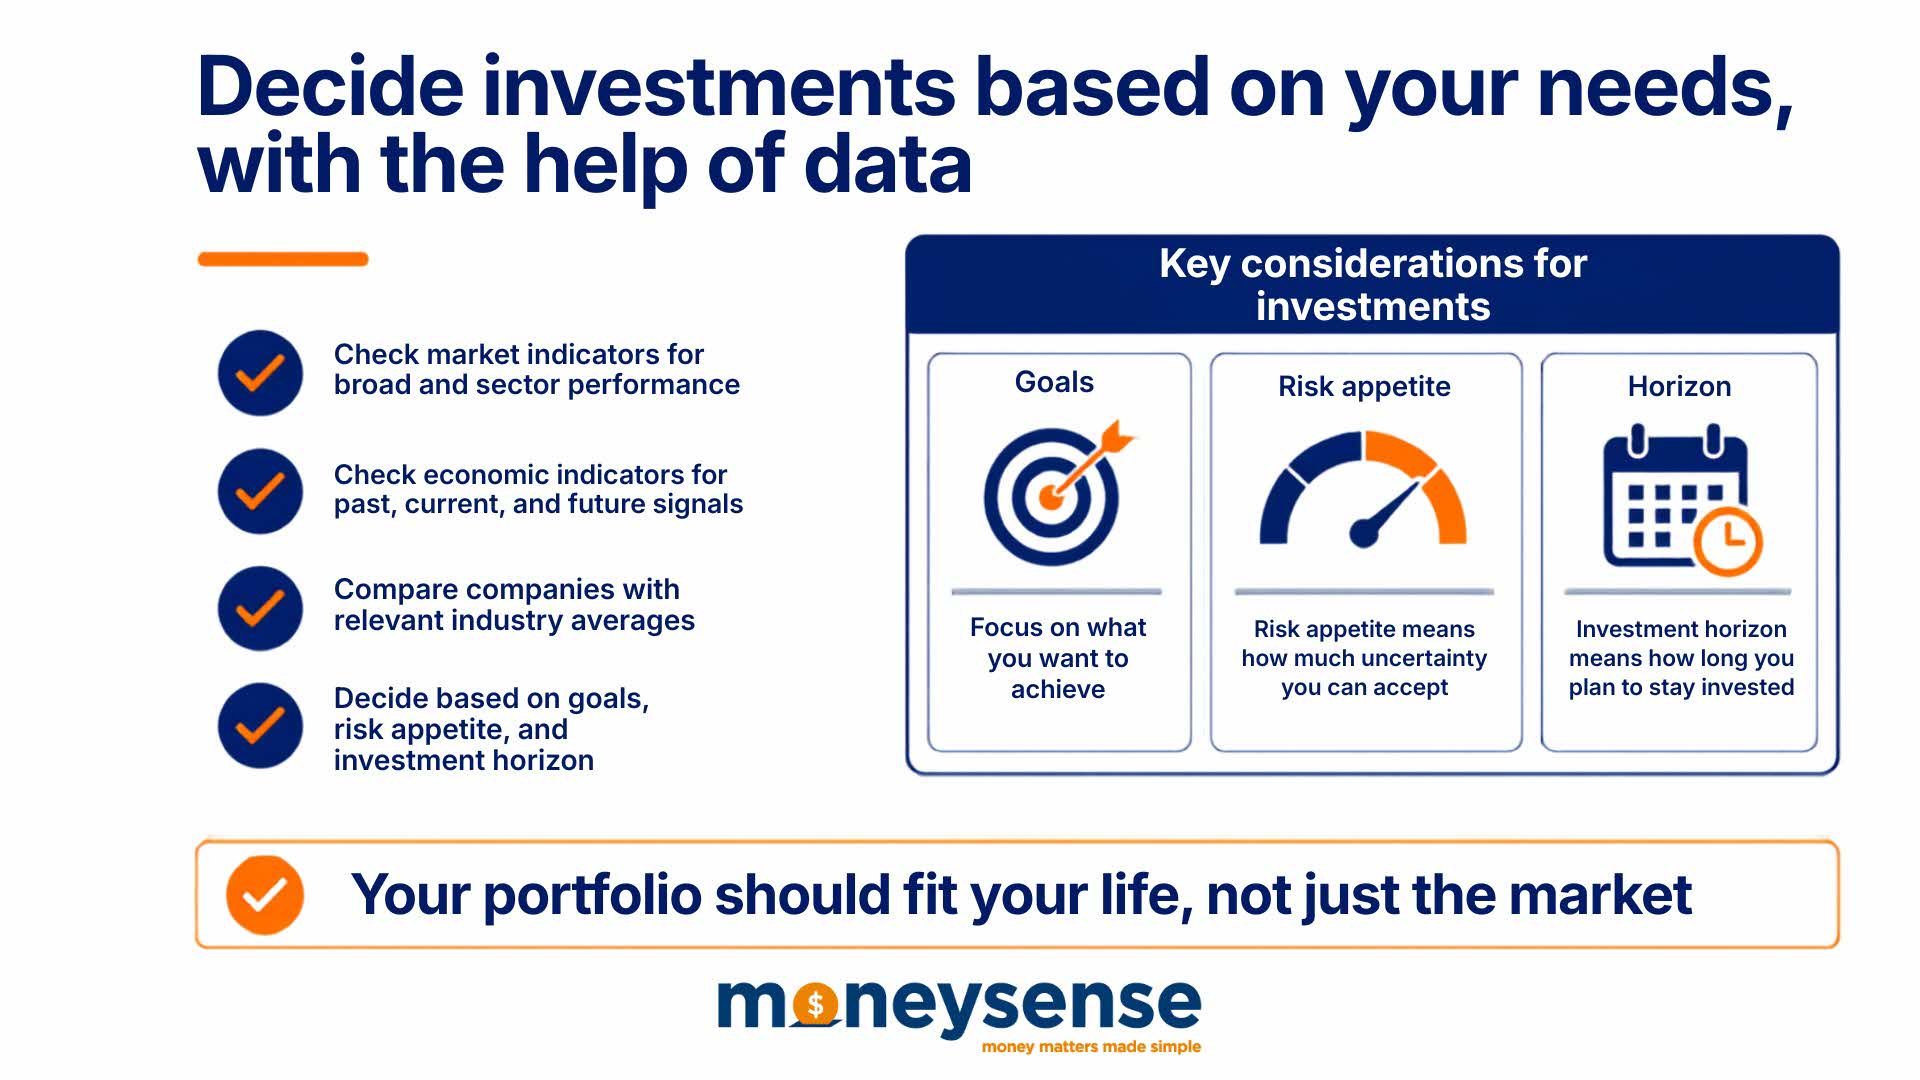
Indicators are tools, not instructions. The same data can point different investors in different directions depending on their goals, risk appetite, and horizon. A retiree living on bond income and CPF withdrawals will interpret rising interest rates very differently from a younger investor building a growth-oriented equity portfolio.
Use indicators as one input among many. Never make significant portfolio changes based on a single indicator or a single day’s data.
Watch out for
Reacting to short-term market movements without considering your long-term horizon. Selling in a panic during a downturn may result in losses.
Ignoring your portfolio for long periods. Even passive investors need to regularly check that their allocation continues to match their goals.
Over-reacting to economic data. One weak GDP reading does not necessarily signal a recession; one strong jobs report does not signal runaway inflation.
Your next steps
Check the STI’s performance over one, three, and five years on the SGX website (sgx.com (opens in new tab)). Note how it compares to the same periods in your portfolio.
Identify which of your holdings are “cyclical” (benefit from economic expansion) and which are “defensive” (more stable during downturns). Consider whether your current balance matches your outlook.
Set a regular portfolio review schedule — at least once a year, or after any major economic event or personal life change.
If your portfolio has drifted significantly from your original asset allocation, consider rebalancing to bring it back in line with your goals.
For an overview on maintaining your investment portfolio
Frequently asked questions (FAQ)
How often should I review my investment portfolio?
Review your portfolio at least once a year, and after any major life event — marriage, birth of a child, job change, or approaching retirement. For more volatile holdings, more frequent monitoring may be appropriate. Avoid making changes in response to daily market movements; focus on whether your portfolio still aligns with your long-term goals and risk appetite.
What is the Straits Times Index (STI) and how do I use it?
The STI tracks the 30 largest companies listed on the SGX by market capitalisation, accounting for roughly two-thirds of the Singapore market. When the STI rises or falls, we say the market has moved. Use the STI as a benchmark to compare your portfolio's performance over meaningful periods — one year, three years, five years — not just day-to-day movements.
What are leading, lagging, and coincident economic indicators?
Leading indicators change before the economy shifts and help forecast trends — examples include stock market performance and the Consumer Confidence Index. Lagging indicators confirm trends after they have occurred — examples include unemployment rates, GDP, and corporate profits. Coincident indicators change in step with the economy — like payroll data. Analysts use all three together to understand where the economy has been, is now, and is likely to go.
What is the difference between cyclical and defensive investments?
Cyclical investments (like construction, travel, and luxury goods stocks) tend to perform well when the economy is growing and poorly during contractions. Defensive investments (like utilities, healthcare essentials, and consumer staples) have stable demand regardless of economic conditions. Balancing cyclical and defensive holdings can reduce your portfolio's sensitivity to economic cycles.
What is the Purchasing Managers’ Index (PMI) and what does it tell investors?
The PMI measures activity in the manufacturing sector. A reading above 50 signals expansion; below 50 signals contraction. It is a widely-watched early indicator of economic momentum and can signal whether conditions are improving or worsening before official GDP figures are released.
What should I do when my portfolio has drifted from its target allocation?
Rebalance: sell assets that have grown above their target weight and buy those that have fallen below, to restore your intended risk level. Do this on a schedule (annually is typical) rather than in response to market events, to avoid making emotional decisions.
Related articles
Putting together an investment portfolio
A good portfolio doesn’t manage itself. Learn how to diversify, allocate assets, rebalance strategically, and keep your Singapore investments aligned with your real financial goals.
Managing investment risk
Higher returns always come with higher risk—but which risks are you actually taking? Understand market, credit, liquidity, and currency risk before building your Singapore portfolio.
What is investing?
Saving is not enough to beat inflation. Discover why Singaporeans invest, how risk and return are linked, and what separates smart investing from costly speculation.